
Data Visualization & Power BI Dashboard Services
Transform raw data into executive-ready insights.
Syncverse Solutions delivers professional data visualization services powered by Microsoft Power BI and Microsoft Fabric. We design interactive dashboards, executive reports, and real-time performance monitoring systems that help leadership teams make faster, data-driven decisions. Our dashboards are built with clarity, usability, and business context at the core — ensuring insights are actionable, accurate, and aligned with organizational goals.
Why Businesses Struggle with Data Visualization & Reporting
As organizations scale, reporting becomes increasingly fragmented across Excel sheets, CRM systems, ERP platforms, and department-level tools. Without a structured data visualization strategy, leadership teams struggle to gain real-time visibility into business performance.
Manual data consolidation, inconsistent KPIs, and outdated reports slow down decision-making and reduce confidence in analytics. Businesses require centralized, interactive dashboards powered by modern tools like Microsoft Power BI to transform raw data into actionable insights.
Scattered Excel reports and data silos
Manual and error-prone data consolidation
Lack of real-time performance visibility
No centralized KPI tracking system


Enterprise-Grade Power BI Dashboard & Data Visualization Solutions
Our data visualization services focus on building interactive, real-time dashboards using Microsoft Power BI and Microsoft Fabric. We transform complex business data into clear, actionable insights tailored for executives, managers, and operational teams.
From KPI tracking and financial reporting to operational monitoring and performance analytics, our dashboards provide centralized, automated reporting systems designed for enterprise scalability.
Executive KPI Dashboards
Real-time performance dashboards for CXOs with revenue, growth, cost, and profitability metrics.
Operational Performance Monitoring
Track sales pipelines, inventory levels, production metrics, and operational efficiency.
Interactive Drill-Down Analytics
Dynamic filtering, cross-report linking, and granular data exploration for deeper insights.
Automated Report Distribution
Scheduled report generation and automated sharing with stakeholders.
Cross-Platform Data Integration
Unified dashboards integrating CRM, ERP, finance, marketing, and cloud applications.
Why Choose Microsoft Power BI & Fabric for Enterprise Data Visualization
Our data visualization services leverage Microsoft Power BI integrated within the Microsoft Fabric ecosystem to deliver scalable, secure, and enterprise-ready reporting systems built for long-term growth.
Unified Data Ecosystem
Microsoft Fabric centralizes data storage, transformation, and reporting within a single scalable architecture.
Real-Time Interactive Dashboards
Power BI enables dynamic, drill-down dashboards with real-time KPI tracking and performance visibility.
Enterprise-Grade Security
Role-based access control, encryption, and governance frameworks ensure data integrity and compliance.
Scalable Analytics Infrastructure
From startup to enterprise, Fabric supports growing data volumes without compromising performance.
Seamless System Integrations
Connect CRM, ERP, finance, and cloud applications into unified reporting dashboards.
Automated Reporting & Insights
Scheduled refresh, automated distribution, and AI-driven analytics streamline business decision-making.
Real-World Power BI Dashboard Implementations
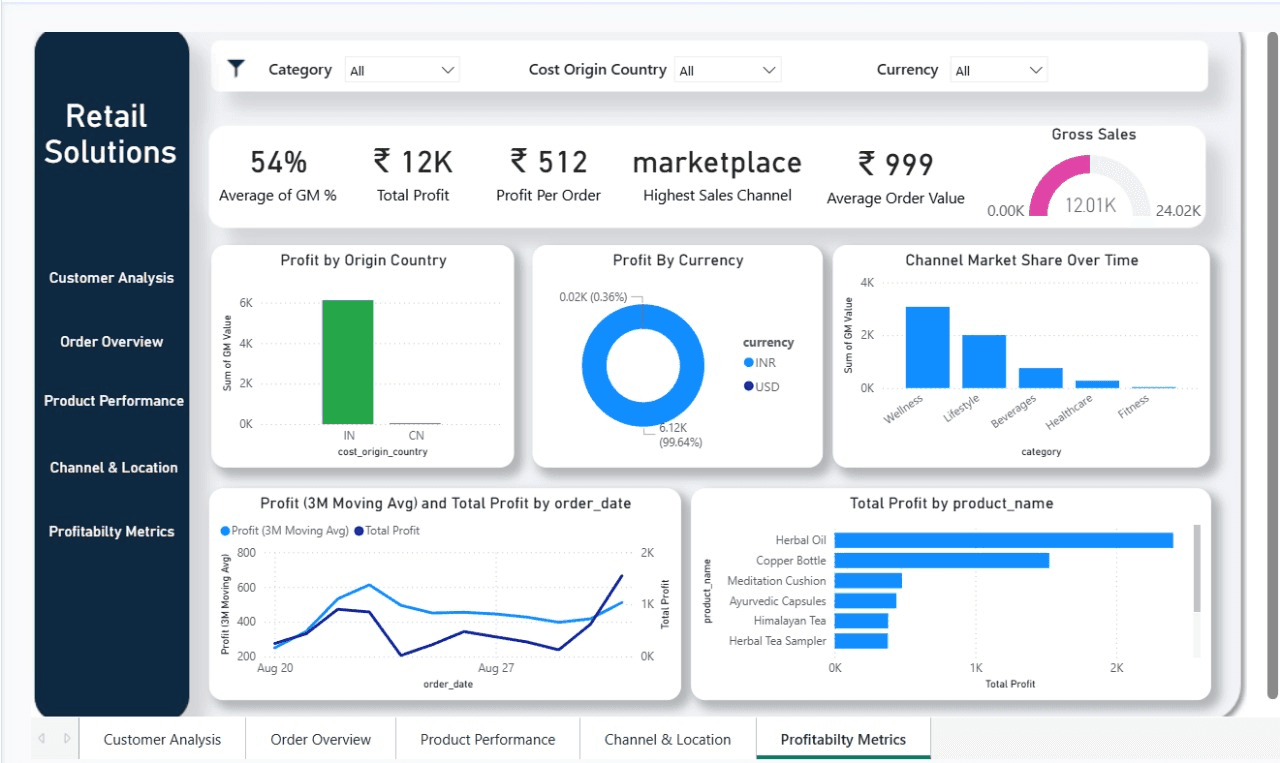
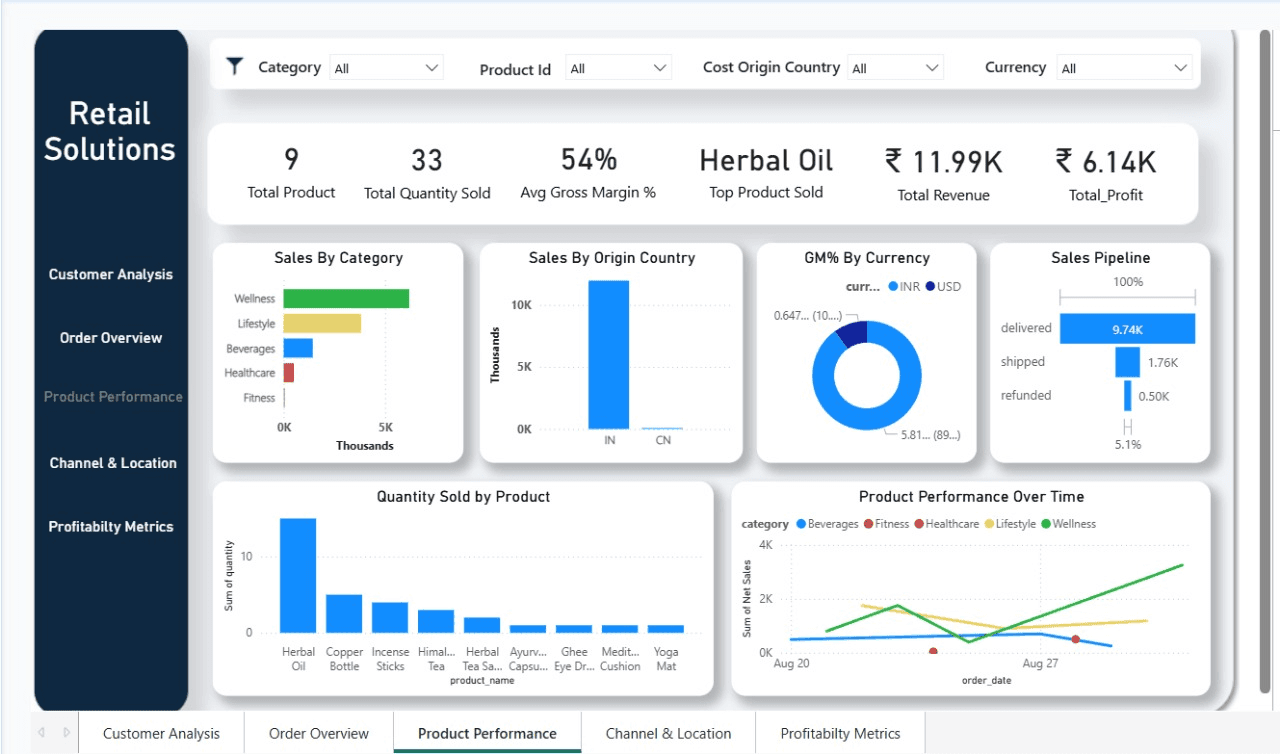
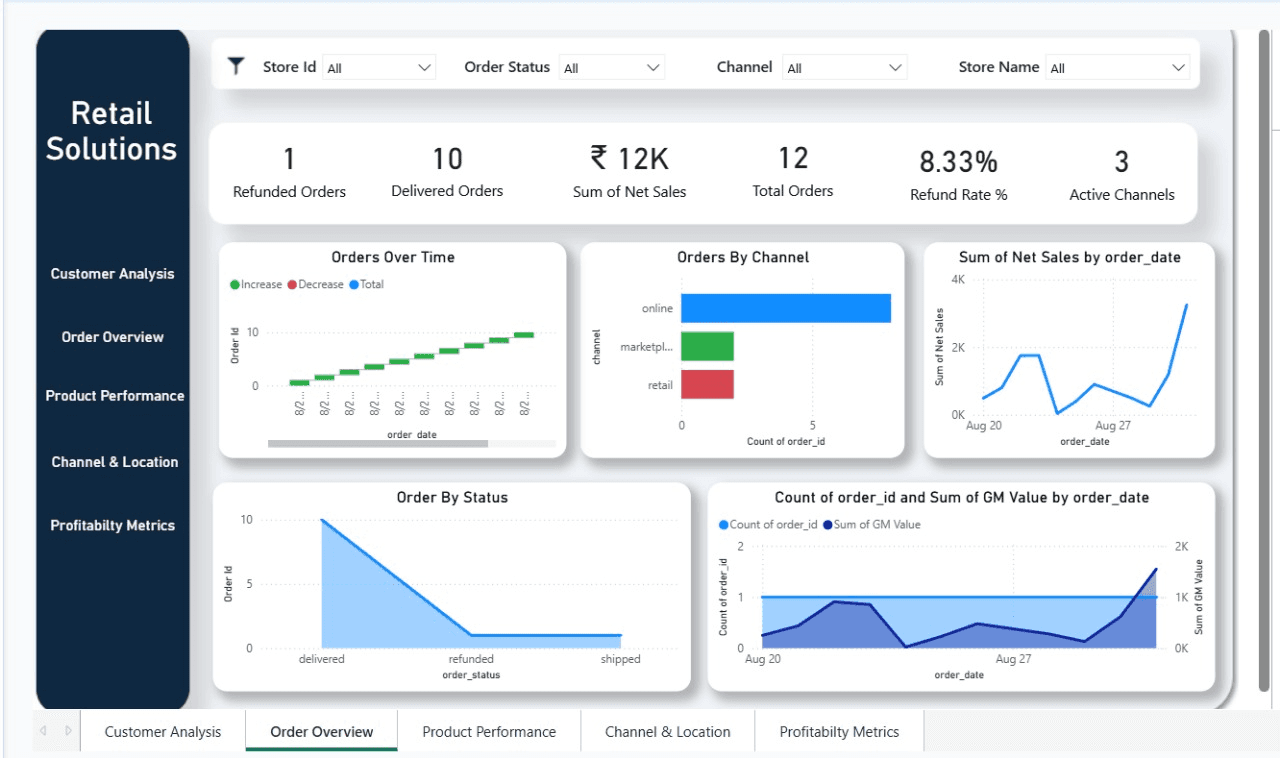
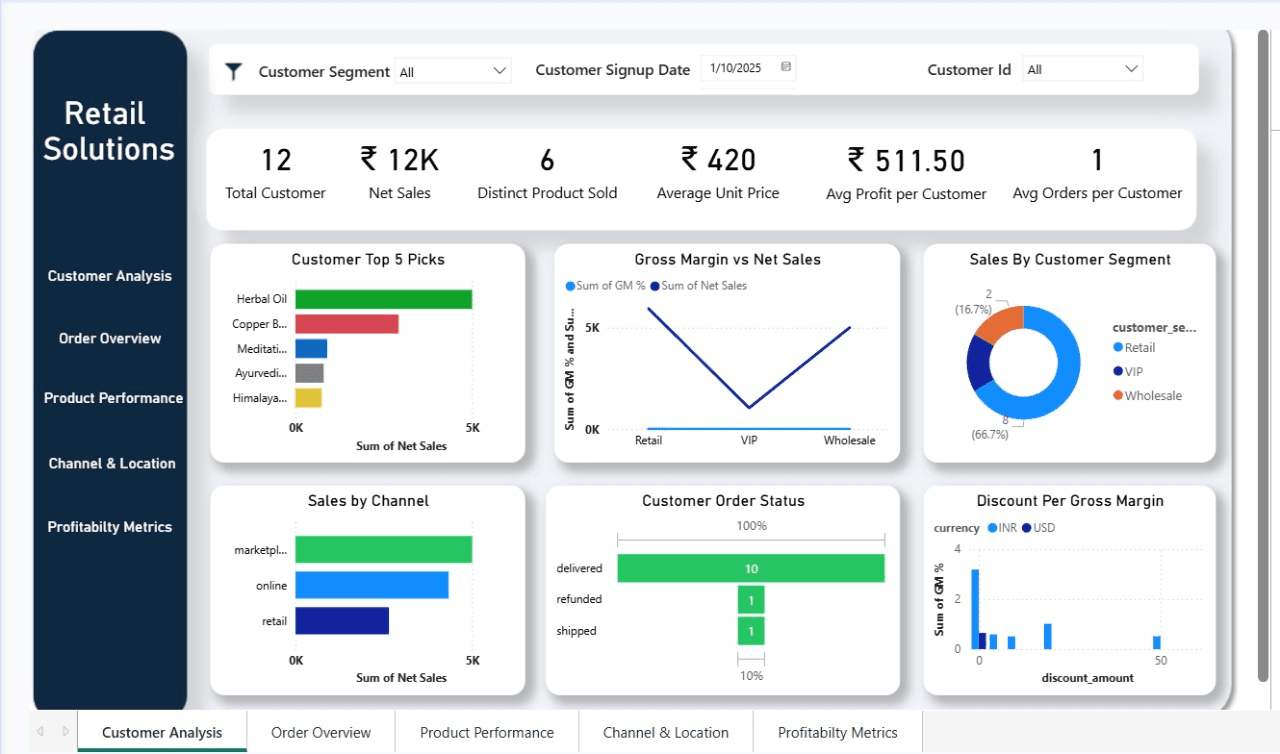
Retail Analytics DashboardPowered by Microsoft Power BI
Our retail data visualization solutions transform fragmented sales, inventory, and customer data into centralized, interactive Power BI dashboards. Designed for leadership teams, these dashboards deliver real-time visibility into revenue performance, stock movement, regional trends, and profitability metrics.
Revenue & Margin Intelligence: Track sales trends, profit contribution, and performance by category.
Inventory Optimization: Monitor stock turnover, aging inventory, and replenishment cycles.
Regional Performance Analysis: Compare store-level KPIs across geographies.
Customer Behavior Insights: Identify purchasing patterns and demand forecasting signals.
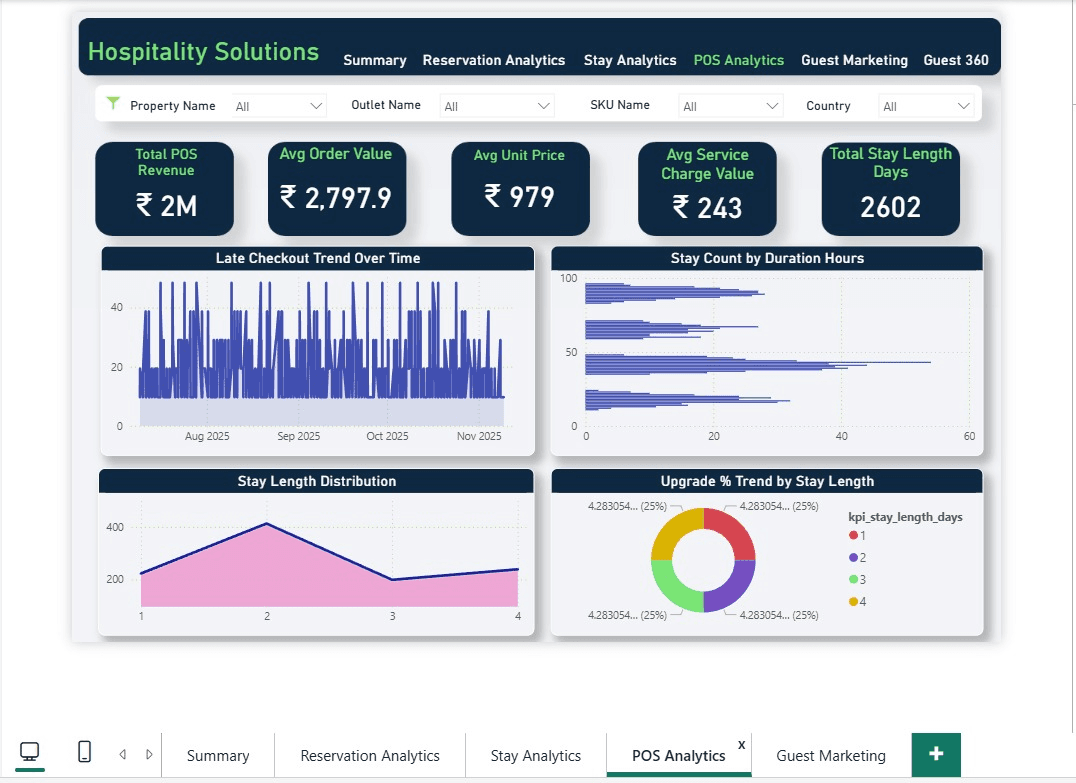
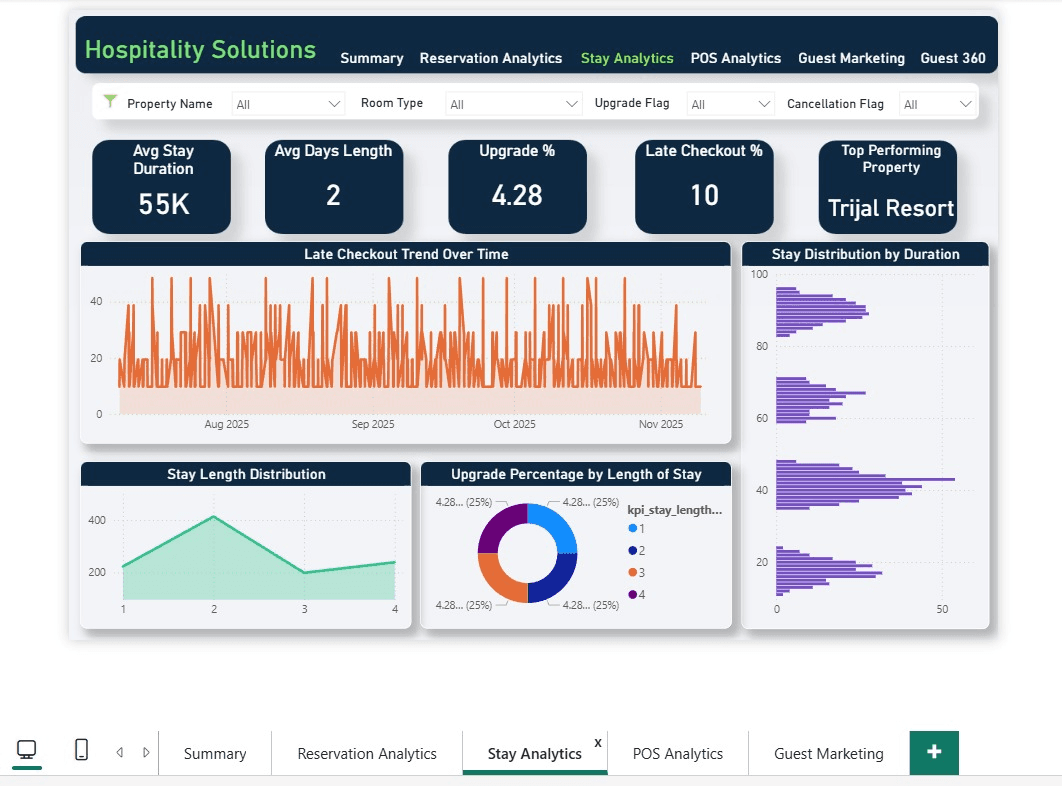
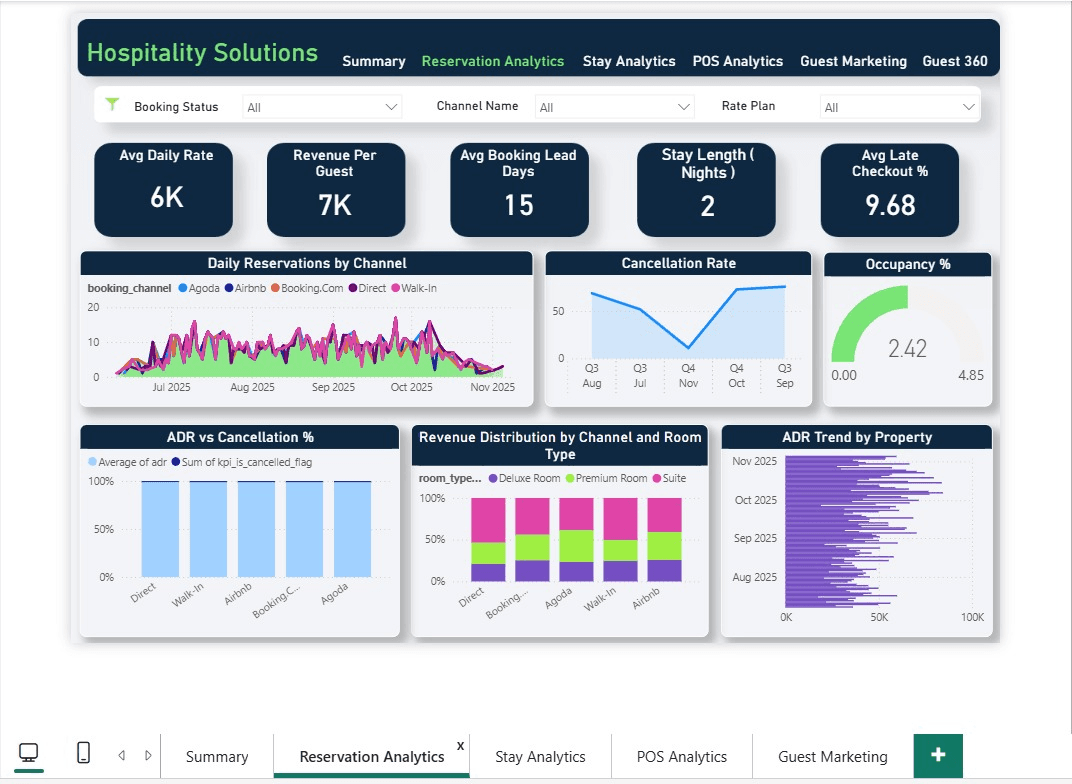
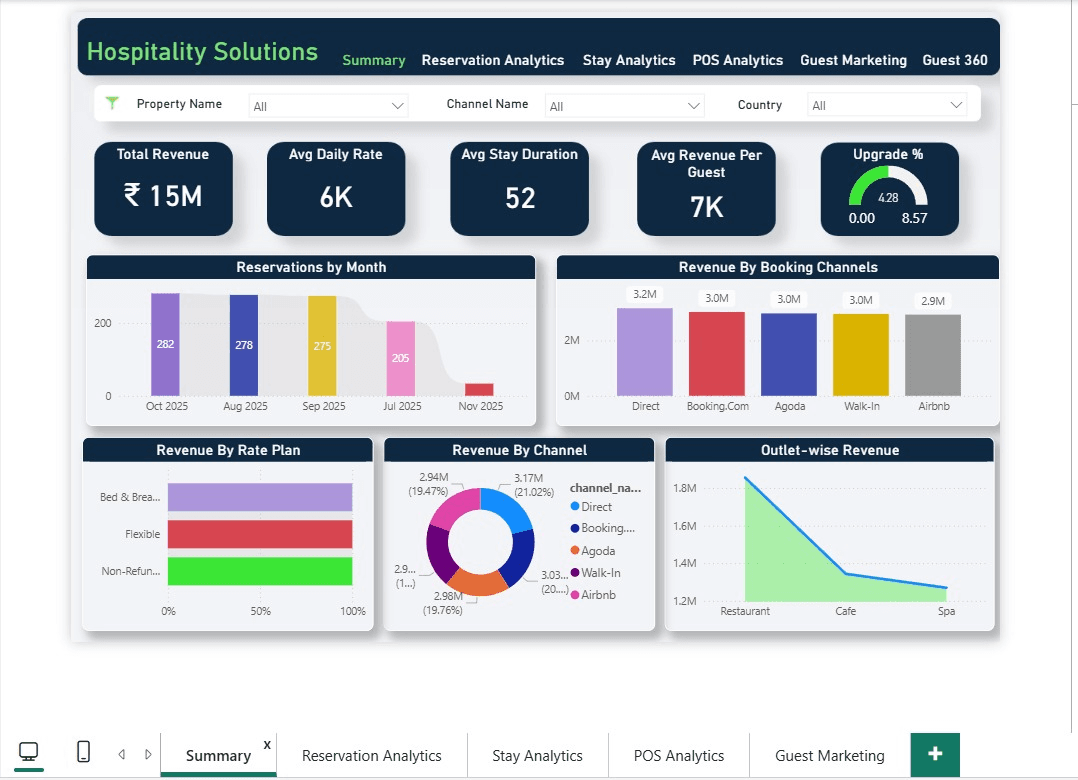
Hospitality Performance DashboardReal-Time Revenue & Operations Analytics
Our hospitality data visualization dashboards provide leadership teams with real-time visibility into occupancy rates, booking channels, revenue performance, and operational KPIs. Built using Microsoft Power BI and integrated through Microsoft Fabric, these dashboards centralize hotel management systems, finance data, and channel analytics into a unified reporting environment.
Occupancy & RevPAR Tracking: Monitor real-time room utilization and revenue performance metrics.
Channel Performance Analysis: Evaluate OTA, direct bookings, and marketing-driven conversions.
Operational KPI Monitoring: Track housekeeping efficiency, staffing utilization, and service metrics.
Profitability & Cost Insights: Analyze expense trends and optimize property-level margins.
Transform Your Business Data IntoExecutive-Ready Power BI Dashboards
Whether you operate in retail, hospitality, or enterprise environments, our data visualization solutions powered by Microsoft Power BI and Microsoft Fabric deliver centralized analytics, real-time KPI tracking, and scalable reporting infrastructure designed for long-term growth.
Trusted by growth-focused businesses seeking scalable analytics infrastructure.
Get Free Consultation
Share your requirements and our team will connect with you.
Frequently Asked Questions
Data visualization is the process of converting complex datasets into visual formats such as dashboards, charts, and interactive reports to support faster and more informed decision-making.
Yes. We specialize in Microsoft Power BI dashboard development and integrate it within Microsoft Fabric to deliver scalable and secure reporting solutions.
Absolutely. We integrate dashboards with Zoho CRM, ERP platforms, finance systems, and other enterprise applications for centralized reporting.
Yes. We design real-time or near real-time dashboards depending on business requirements and system capabilities.
Yes. Data visualization focuses on presenting insights visually, while business intelligence includes data modeling, KPI framework design, and strategic analytics architecture.
Build Interactive Power BI Dashboards for Smarter Decisions
Turn your business data into real-time, executive-ready dashboards powered by Microsoft Power BI and Microsoft Fabric.
Discuss Your Dashboard Requirements